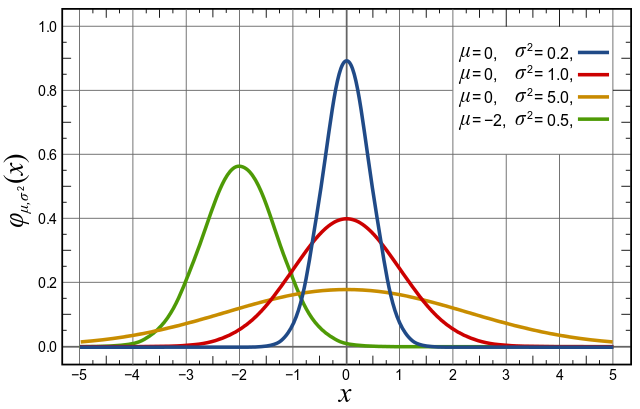
Normal Distributions are the most common distributions in statistics primarily because they describe a lot of natural phenomena. Normal distributions are also known as ‘Gaussian distributions’ or ‘bell curve’, because of the bell shaped curve.
Samples of heights of people, size of things produced by machines, errors in measurements, blood pressure, marks in an examination, wages payed to employees by a company, life span of a species, all of these follows a normal or nearly normal distribution.
I don’t intend to cover a lot of mathematical background regarding normal distributions, still it won’t hurt to know just a few simple mathematical properties of normal distributions:
- Bell curve is symmetrical about mean(which lies at the center)
- mean = median = mode
- Only determining factors of normal distributions are its mean and standard deviation
We can also get a normal distribution from a lot of datasets using Central Limit Theorem(CLT). In layman’s language CLT states that if we take a large number of samples from a population, multiple times and go on plotting these then it will result in a normal distribution(which can be used by a lot of statistical and machine learning models).
A lot of machine learning models assumes that data fed to these models follows a normal distribution. So, after you have got your data cleaned, you should definitely check what distribution it follows. Some of the machine learning and Statistical models which assumes a normally distributed input data are:
- Gaussian naive Bayes
- Least Squares based (regression)models
- LDA
- QDA
It is also quite common to transform non-normal data to normal form by applying log, square root or similar transormations.
If plotting the data results in a skewed plot, then it is probably a log-normal distribution(as shown in figure below), which you can transform into normal form, simply by applying a log function on all data points.
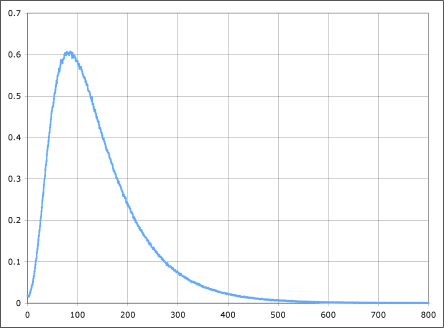
Once it is transformed into normal distributions, you are free to use this dataset with models assuming a normal input data(as listed in above section).
As a general approach, Always look at the statistical/probability distributions as your first step in data analysis.